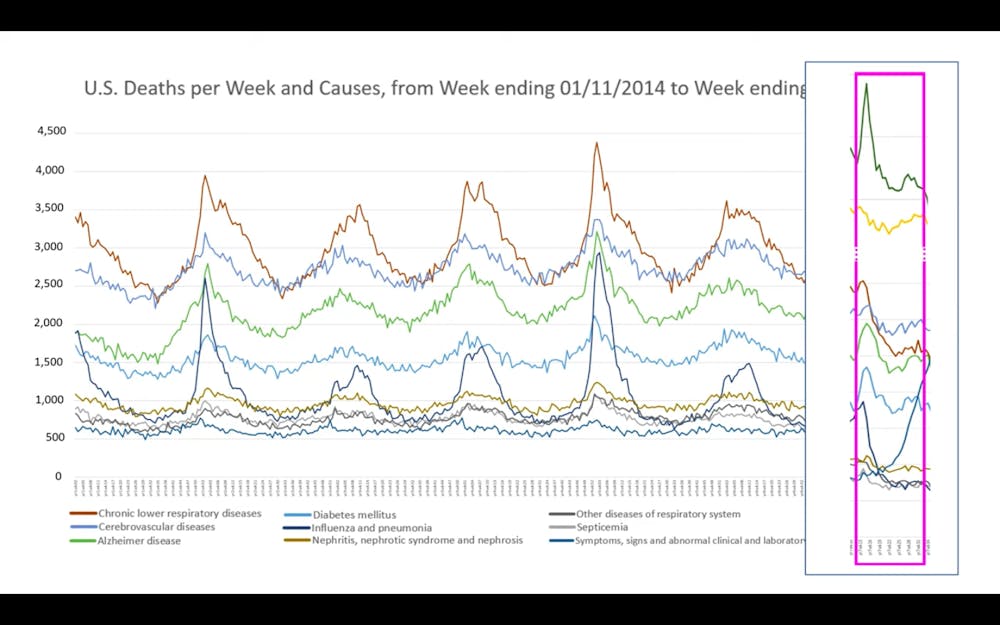
COURTESY OF GENEVIEVE BRIAND
Graph depicts the number of deaths per cause during that period in 2020 to 2018.


COURTESY OF GENEVIEVE BRIAND
Graph depicts the number of deaths per cause during that period in 2020 to 2018.