Published by the Students of Johns Hopkins since 1896
July 2, 2026July 2, 2026 | Published by the Students of Johns Hopkins since 1896
figure 5.png
·
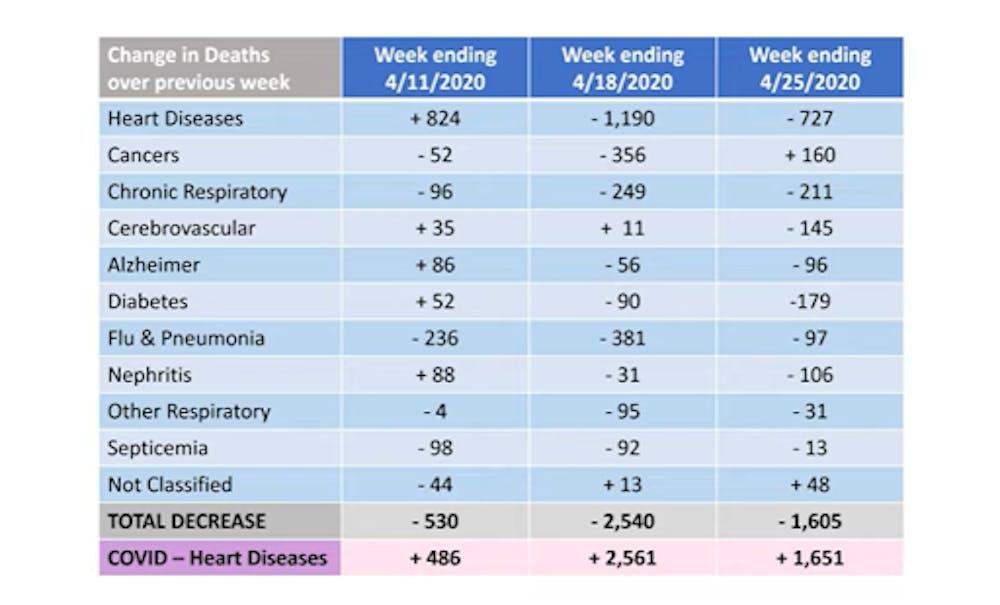
COURTESY OF GENEVIEVE BRIAND
Figure 5.For the weeks ending April 11, April 18 and April 25, this table presents the change in the number of U.S. deaths due to select causes compared to the week prior.
The grey row is the total decrease in the number of deaths due to select causes compared to the previous week, calculated by combining the negative numbers in each column. The pink row shows the difference between deaths due to COVID-19 and deaths due to heart diseases.