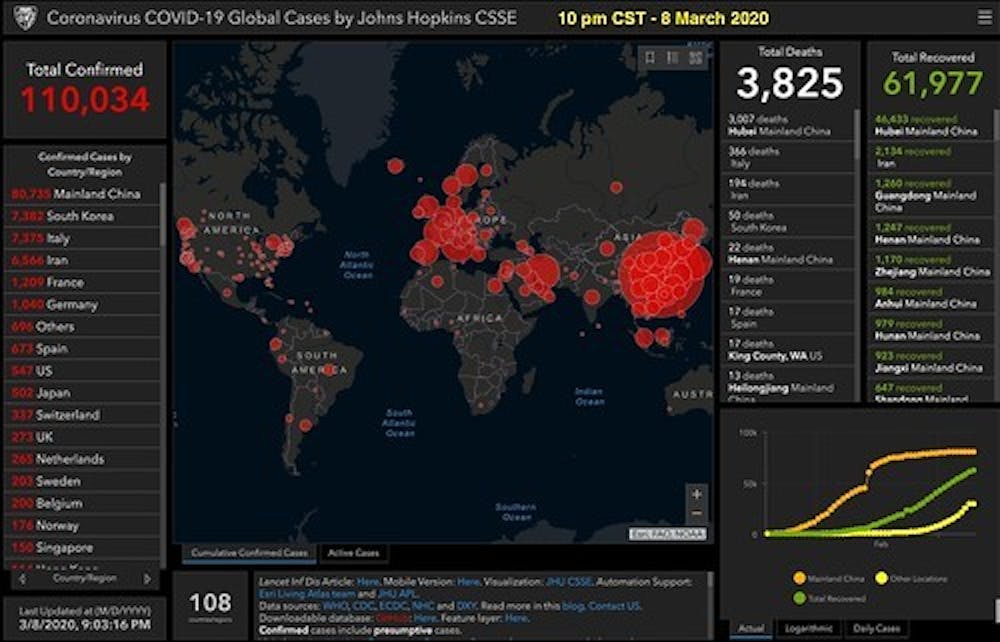
Jan. 22 marked one year since the launch of the Johns Hopkins Coronavirus Resource Center (CRC). Upon its launch, the website became a preferred source for the general public and news media over the world, including the Washington Post, the Wall Street Journal and the New York Times.
The CRC was also named as one of 2020’s Best Inventions by Time, which described the website as “2020’s Go-To Data Source.” Lauren Gardner, the director of the CRC, also appeared on 2020’s Time 100 list, which celebrates the most influential people in the world.
In the battle against COVID-19, data about the transmission of the virus is integral to containment efforts meant to reduce the burden of the disease in our communities. The task of assembling a resource capable of tracking the virus throughout the world was enormous.
The origin of this incredible success was a partnership between Gardner, a civil and systems engineering professor at the Whiting School of Engineering, and her graduate student Ensheng Dong. As a first-year graduate student, Ensheng had been modeling measles outbreaks for his thesis. However, he quickly pivoted when the virus appeared.
Dong enlisted the help of his thesis advisor, Gardner, who is also the co-director of the Center for Systems Science and Engineering (CSSE), to assist in building the platform. Within days of its release, the site was receiving more than 200 million interactions per day.
The website is now maintained by over two dozen people at the CSSE, with technical support from the Hopkins Applied Physics Laboratory and also from Esri, the company providing the mapping software.
The dashboard illustrates the location and number of confirmed COVID-19 cases, deaths and recoveries for all affected countries. Additionally, the website provides city-level reports in the U.S., Canada and Australia. The map updates semi-automatically throughout the day, and the dashboard is fed mostly through automated web-scraping and aggregation, updating nearly in real-time.
The CRC receives data from a wide variety of sources, including the World Health Organization (WHO), the U.S. Centers for Disease Control and Prevention, the European Centre for Disease Prevention and Control, national government health departments, local media reports and Dingxiangyuan — one of the world’s largest online communities for health-care professionals.
Using this multi-faceted approach, the website has consistently reported infections ahead of any major health organization in the world, including the WHO.
The developers have also made the website code, and all the data collected and displayed, freely available through a GitHub repository, along with the feature layers of the dashboard, which are now included in the Esri Living Atlas. The repository has enabled a global effort to improve the website and user experience.
Data from the CRC has also contributed to numerous scientific studies, including Gardner’s study on the association between social distancing and COVID-19 transmission in the United States.
Additionally, a National Aeronautics and Space Administration-funded project will analyze how climate and seasonality contribute to the spread of the disease. The team has also received support from the National Institutes of Health and the National Science Foundation for further studies.
The CRC has also received philanthropic donations, including from Bloomberg Philanthropies and the Stavros Niarchos Foundation, for continued operations.
In an interview with The News-Letter, Andrew Pekosz, a professor at the Bloomberg School of Public Health, highlighted the importance of the CRC in guiding public health decision making.
“The availability of accurate data is essential to guiding our response here in the U.S. and throughout the world,” Pekosz said. “Within the U.S., the visualization of data by county can inform the planning of response and containment efforts to reduce the burden of disease.”
Given the popularity and impact of the dashboard to date, team members at CSSE plan to continue hosting and managing the tool throughout the entirety of the pandemic. However, they’re not planning to stop once the pandemic ends.
In an interview with The News-Letter, Marc Trotochaud, an analyst with the Hopkins Center for Health Security, elaborated on the CRC’s future plans.
“As we begin to envision the post-COVID world, we realize that a real-time dashboard of future public health threats is a necessity,” Trotochaud said. “The resource center will continue to build out its capabilities to establish a standing tool to monitor and report on future outbreaks."
These tools may eventually allow public health experts to track illnesses as soon as they appear, thereby improving containment measures. For now, the CRC continues to inform the media, scientists and the public to help contain and eliminate COVID-19.